Which Rail Yard KPIs Matter Most for Measuring Automation ROI?
Why KPIs Matter Before and After Yard Automation
One mistake appears repeatedly in freight yard automation projects: operators install new systems before defining what success actually looks like.
Months later, everyone agrees the yard “feels better,” but nobody can quantify where the operational gain came from or whether the investment truly improved performance. That becomes a problem, especially when executive teams start asking for measurable returns instead of operational impressions.
This is why properly selected Rail yard KPIs matter long before the first sensor, reader, or software platform goes live.
Good automation projects begin with operational baselines. Without them, ROI discussions become subjective very quickly.
What Should Rail Operators Measure Before Automating?
The most useful starting indicators are usually the least glamorous ones:
- Average dwell time
- Search time for misplaced cars
- Manual inventory verification effort
- Switching delays
- Cars handled per shift
- Exception frequency
Simple metrics. But operationally powerful.
I worked with one terminal where crews spent nearly forty minutes per shift just validating inventory discrepancies between field conditions and the yard system. Nobody initially considered it a measurable inefficiency because it had become routine over the years.
That happens often in legacy operations.
Why ROI Requires an Operational Starting Point
A proper baseline allows operators to compare before-and-after conditions realistically. Otherwise, even major improvements become difficult to defend financially.
This is particularly important when evaluating Yard automation ROI. The benefits rarely appear in one dramatic operational change. More commonly, they emerge through dozens of smaller efficiency gains accumulating across shifts, crews, and train cycles.
Which KPIs Show Operational Efficiency Gains?
Once automation becomes operational, several indicators usually reveal improvements quickly.
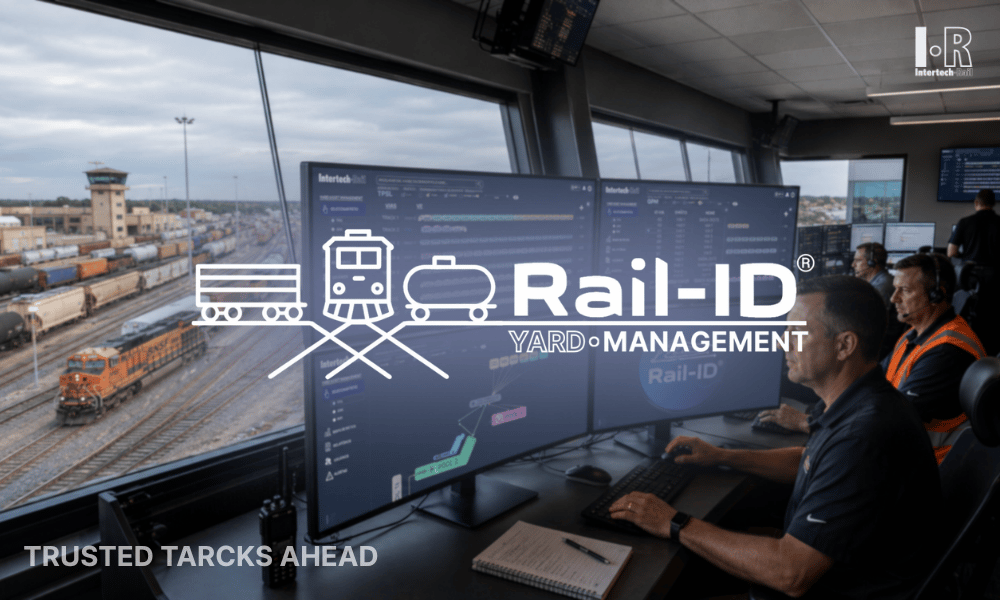
Looking to measure the real operational impact of yard automation? Intertech Rail’s Yard Management, Rail-ID Software, and RFID solutions help rail operators collect more accurate operational data, improve real-time visibility, and track key performance indicators tied to yard efficiency, asset movement, and automation performance across daily rail operations.
Throughput, Cars Handled per Shift, and Switch Moves per Car
Higher throughput with stable staffing levels is one of the clearest operational signs that yard processes are becoming more efficient.
In well-optimized terminals, crews spend less time searching, correcting paperwork, or manually reconciling movements. Switch sequences become more fluid. Yardmasters react faster because information arrives earlier and with better accuracy.
The yard simply operates with less friction. This is where Rail yard productivity metrics start translating into visible field performance rather than spreadsheet analysis alone.
Reduced Manual Counts, Fewer Exceptions, and Faster Reconciliation
Another strong indicator is the reduction in operational exceptions.
Fewer missed pulls. Fewer duplicate records. Fewer disputes about whether a car actually departed or remained inside the terminal.
Small improvements individually. Significant when combined.
Which KPIs Show Financial and Commercial Impact?
Operational efficiency matters, but finance departments usually focus on different questions.
How quickly are services billed?
How much detention exposure exists?
Are customers receiving more reliable shipment visibility?
These are all part of modern Freight yard performance metrics.
How Better Data Supports Customer Visibility and Dispute Reduction
Accurate event records reduce billing disputes substantially. They also improve confidence between railroads, terminals, and customers because movement histories become traceable instead of interpretive. That distinction matters during high-volume operations.
Building an Automation ROI Dashboard
The most effective dashboards combine operational and commercial indicators. Leading indicators, such as dwell growth or increasing exception rates, help identify problems early, while lagging indicators validate long-term performance trends.
The important part is consistency.
Not collecting more data. Collecting useful data that helps the railroad operate better month after month.
GO DEEPER ON THESE TRACKS: Discover how rail operators are using automation, real-time visibility, and operational data to improve yard performance, reduce unnecessary delays, and support more accurate decision-making in What Is Rail Yard Performance Management? The Complete Guide to Turning Yard Data into Operational Results, How Can Rail Operators Reduce Railcar Dwell Time with Real-Time Yard Visibility?, and How Can Automated Rail Yard Event Logs Improve Billing Accuracy and Exception Resolution? These related articles are already published or will be available soon.
What is Yard Management and how does it work?
Yard management is the process of monitoring, organizing, and controlling railcar movements within rail yards and terminals. It involves tracking asset locations, managing switching activities, monitoring dwell times, and maintaining accurate records of yard operations to support efficient train building and asset utilization.
Why is Yard Management important for modern railway operations, and what challenges can it solve, and what benefits does it provide?
Rail yards are critical operational hubs where delays can quickly affect network performance. Effective yard management helps reduce congestion, improve switching efficiency, increase track utilization, shorten dwell times, and provide more accurate information for operational planning, customer service, and billing activities.
What technologies are commonly associated with Yard Management?
Yard management systems commonly use AEI, RFID, railcar tracking technologies, operational databases, mapping interfaces, mobile applications, automated event logging, and analytics platforms. Increasingly, railroads are using real-time data to automate yard processes and improve operational decision-making.
What Intertech Rail solutions are available for Yard Management?
Intertech Rail offers Rail-ID® Yard Management solutions that automatically capture railcar movements and operational events. By combining AEI infrastructure, RFID technology, and centralized software, the platform helps railroads improve yard visibility, track utilization, consist management, and operational efficiency..
Share article